Audirvana Scan Facility - does it get file quality scans wrong?

Using the Scan Facility in Studio to look at some of the FLAC files I have ripped off CD via EAC set up for Bit Prefect (as much as humanely possible) copies then ‘compressing’ the WAV files with FLAC.

For some of the Albums - Audirvana sees the FLAC files as CD ‘quality’, but for others the scan rates some files as MP3 quality as low as 128 - despite the method of rip and encode being exactly the same.

Now I appreciate that ‘crap in’ = ‘crap out’ and the tracks mastered to CD may not have been fantastic (several stages dodgy analogue recordings before mastered to CD) - but when two tracks off the same album have widely varying results… what gives.

A deeper explanation of how the scan capability works would be appreciated

Seen that too, mp3 128, not even 320 :grinning:
Seen hires mono with all the check marks not being hires
Seen 24/192 with 96000 not checked marked
Doesn’t work over 24/192

But this scan thing is not from Audirvana it is from a repute entity i cant remember the name now, like a plugin in Audirvana that needs internet to work?? Why? :disappointed:

The Audio Scan analyses the audio content of the track played and therefore is only available during playback.

It is based on an algorithm that reveals its actual resolution and checks if it matches the audio quality featured in the file metadata. It has been developed in partnership with Ircam Amplify, the business entity of the research lab IRCAM (Institute for Research and Coordination of Acoustics and Music) founded by Pierre Boulez.

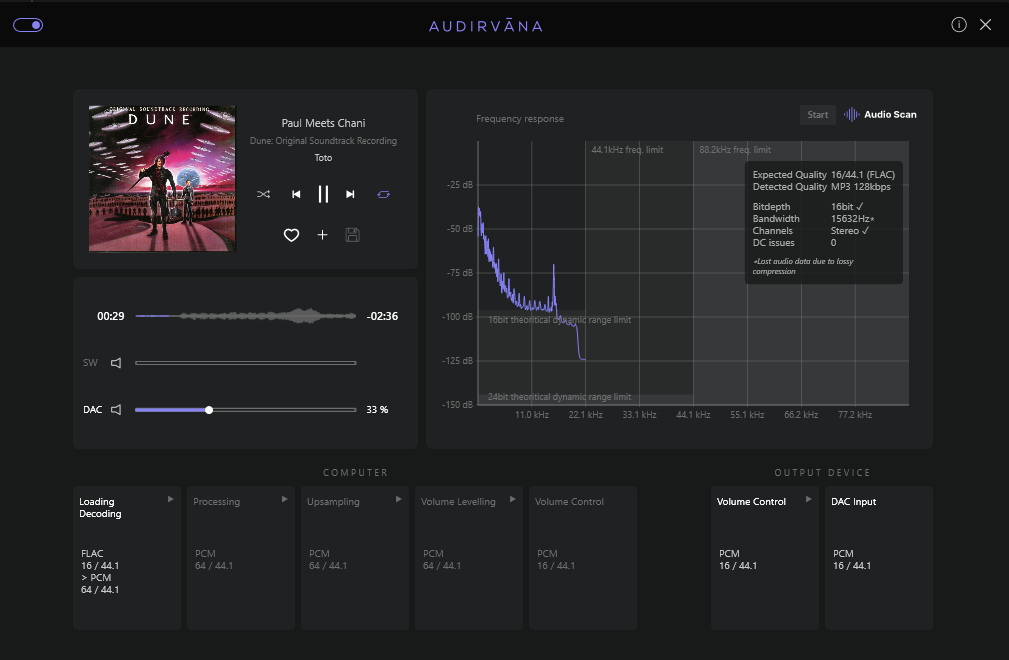
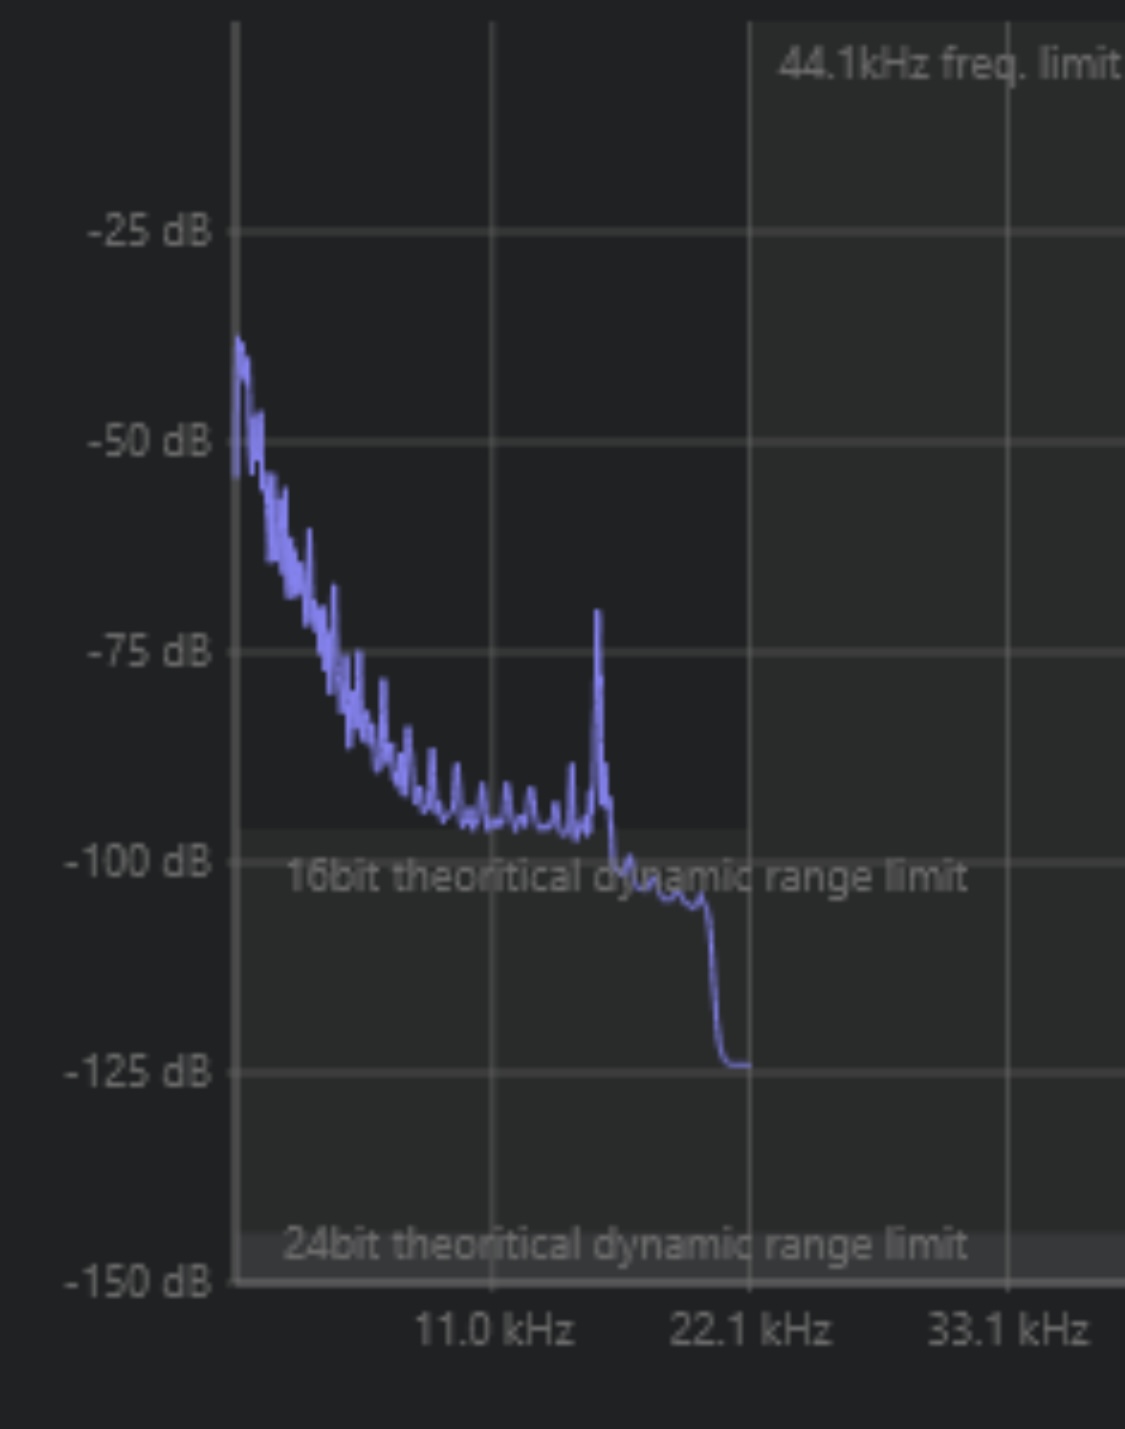
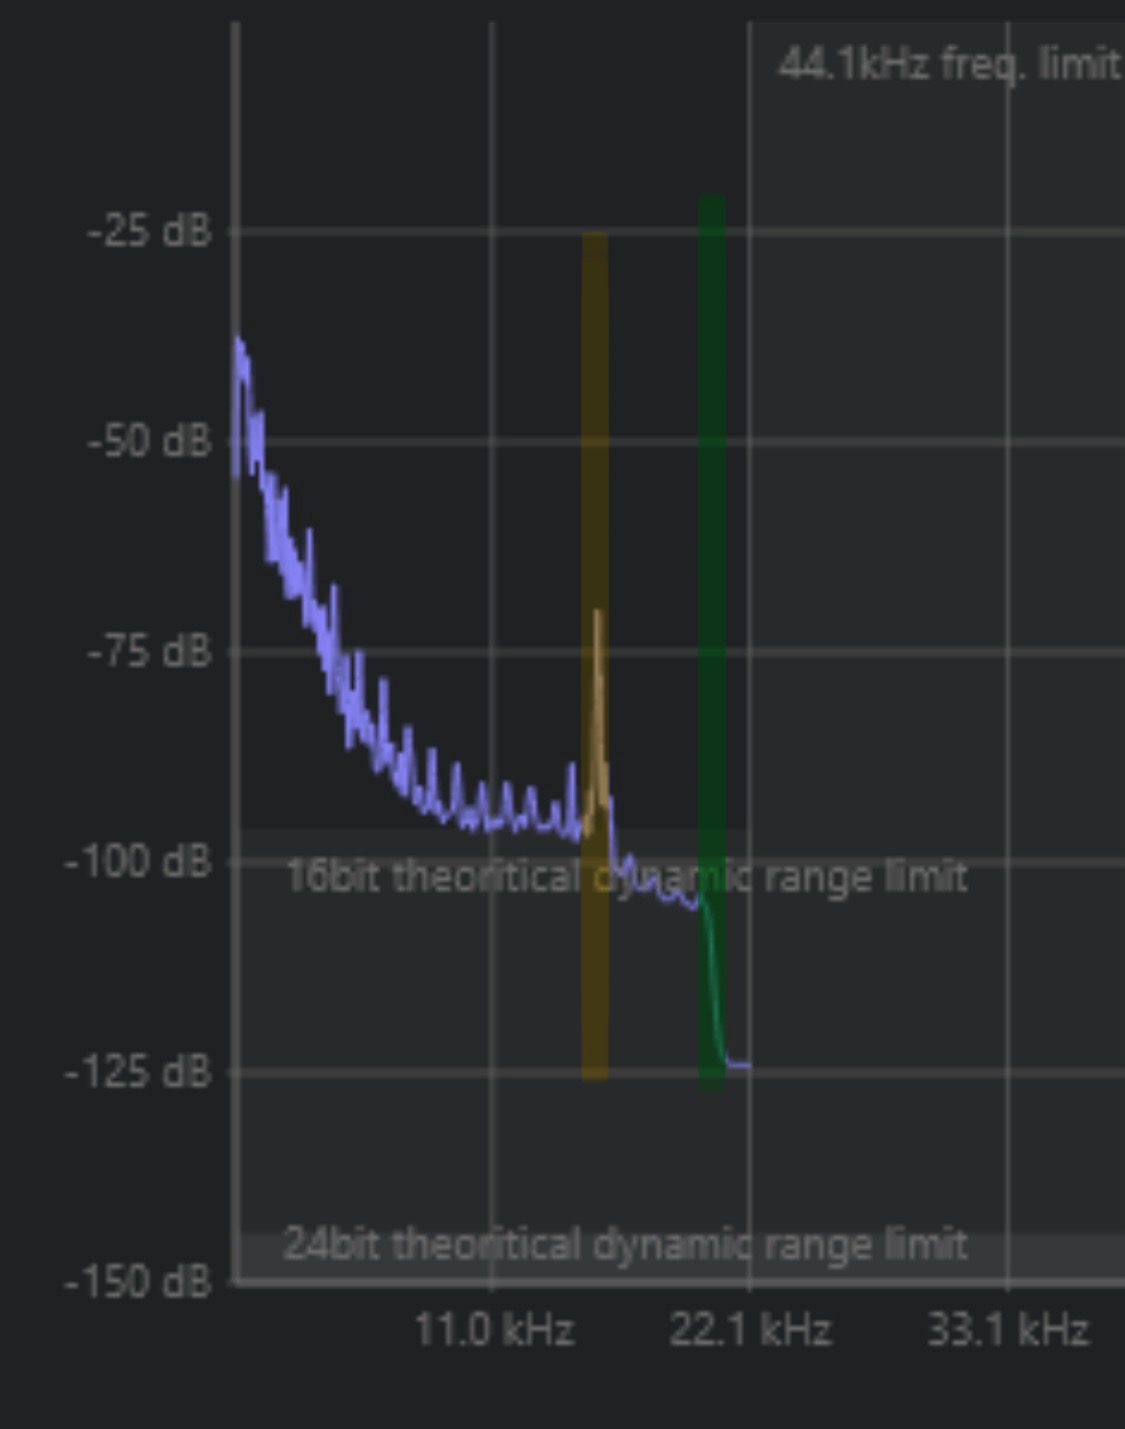
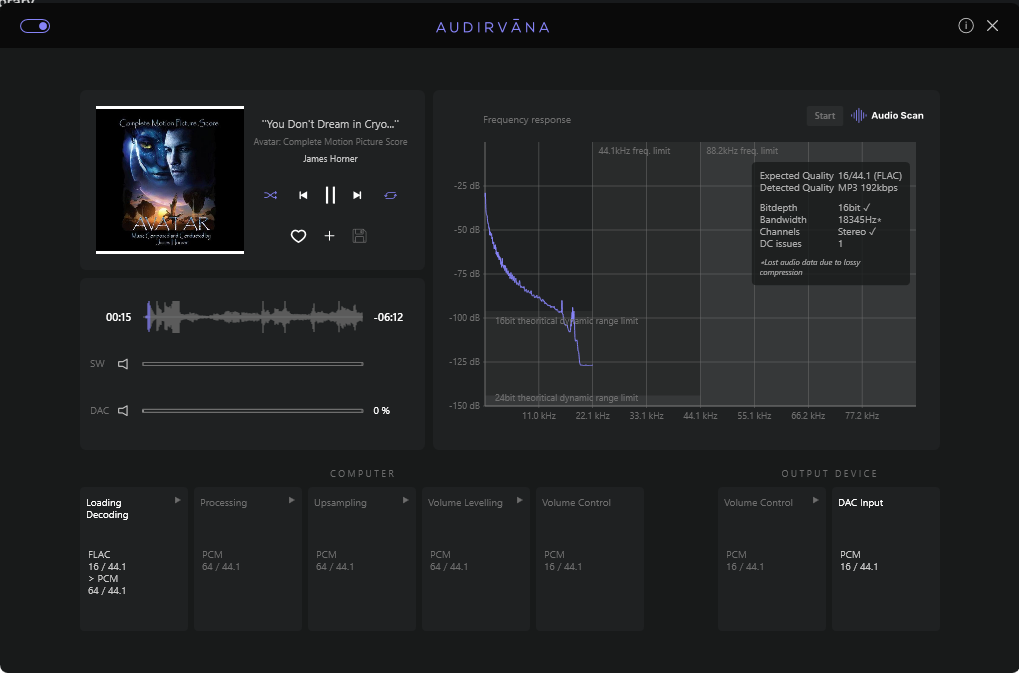
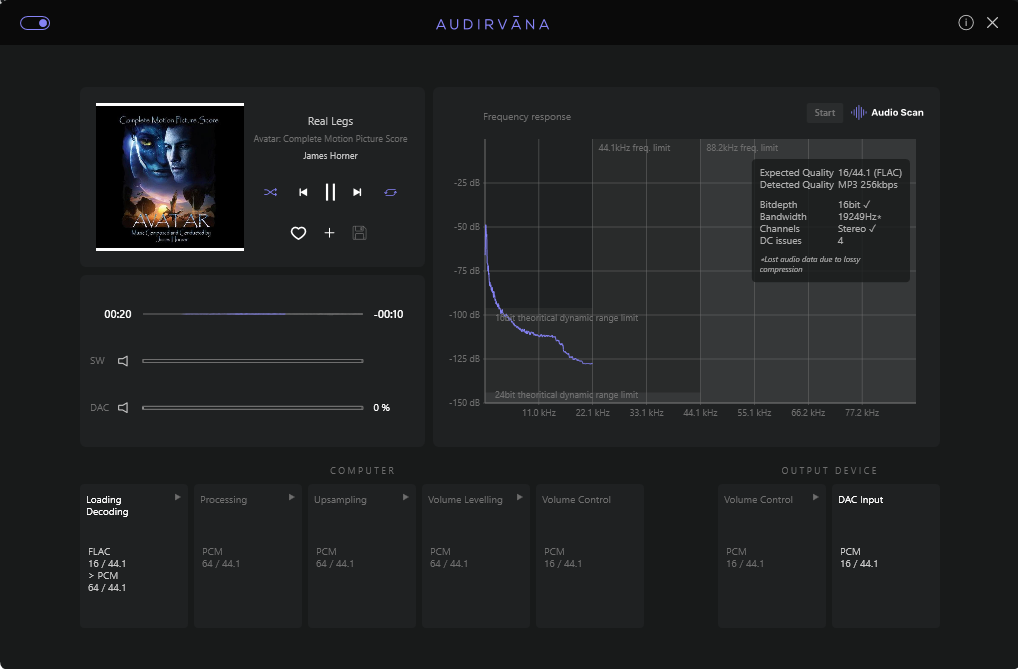
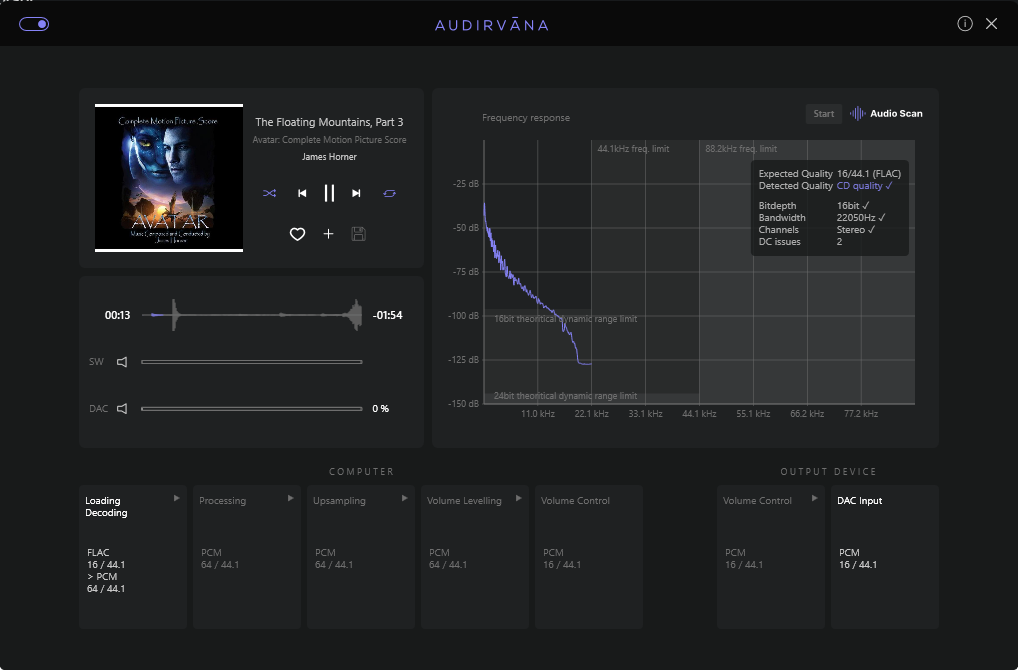
The graph displays the frequency response of the audio track, i.e. the average loudness (dB) in the recording for each frequency (kHz). Loudness is expressed in negative dB (logarithmic) scale vs max nominal value =1. Low frequencies usually have the highest energy level across the frequency range, thus the graph usually shows a decreasing slope from left to right.
Depending on the resolution of the track, this response is contained within an area (grey zones). The average loudness for a frequency can get below the theoretical limitation because it is an average value.

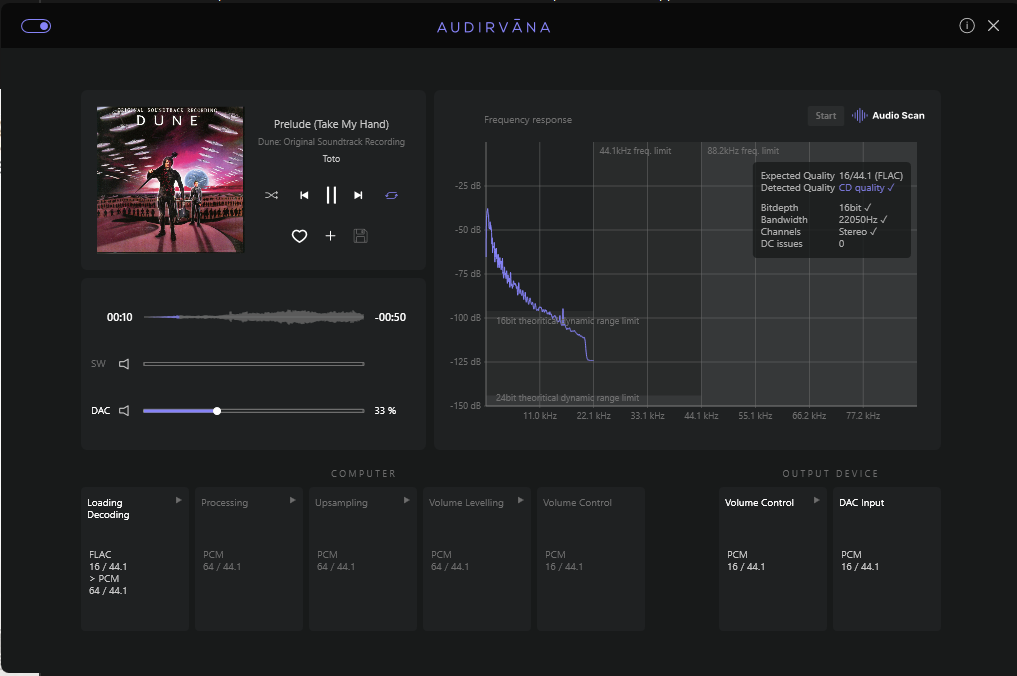
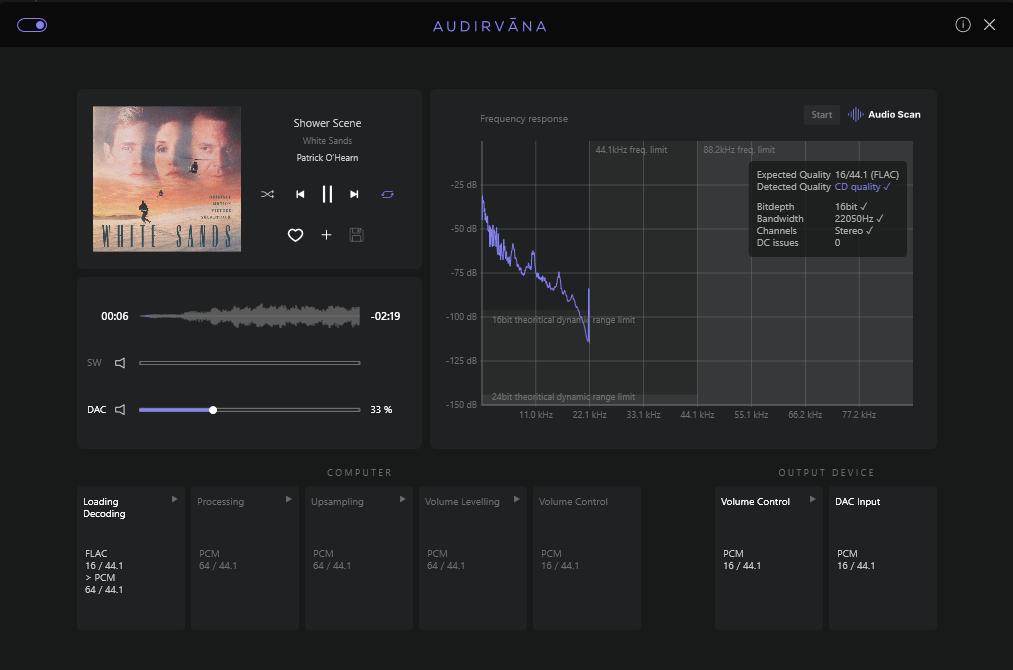
A sharp drop around 22kHz is typical of oversampled CD-quality recording since the maximum frequencies reproduced in a song are equal to half the sampling rate.

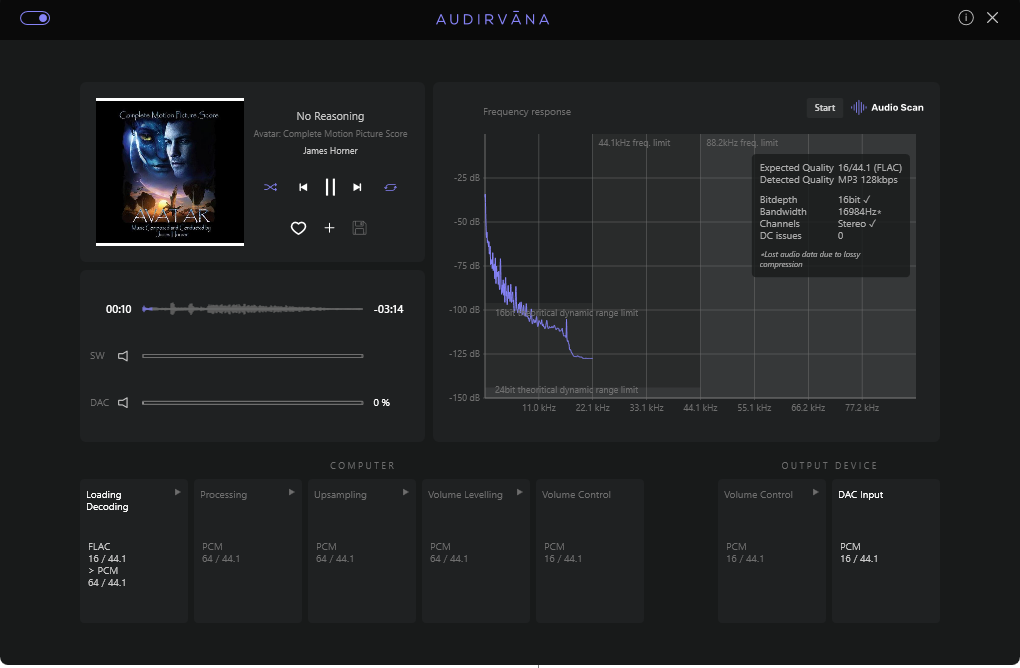
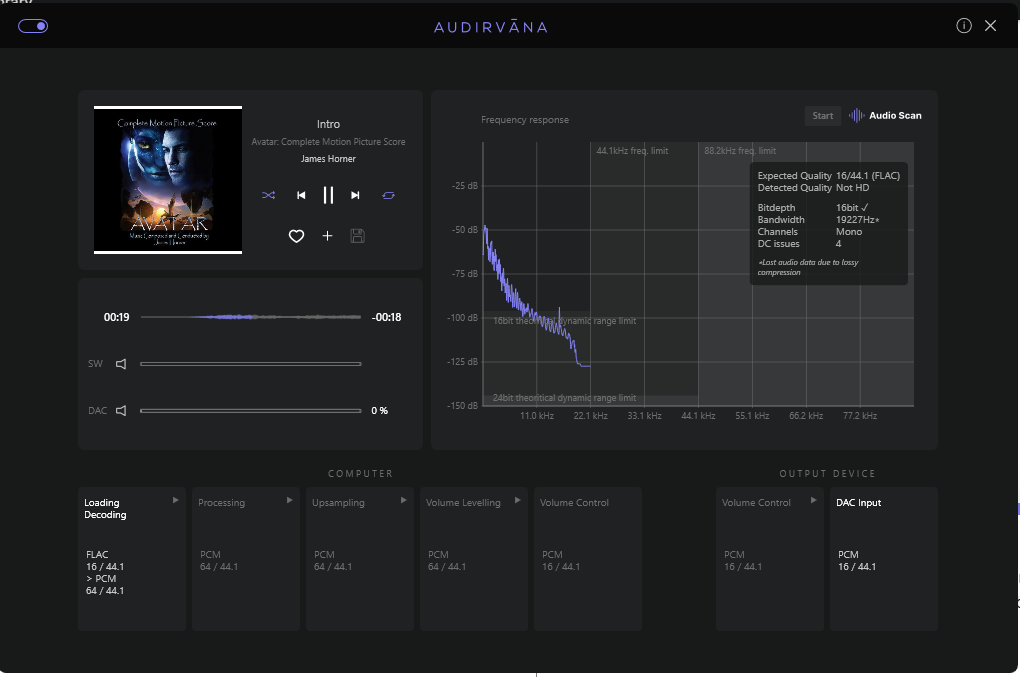
The scan results displayed in the frame contain the following information:

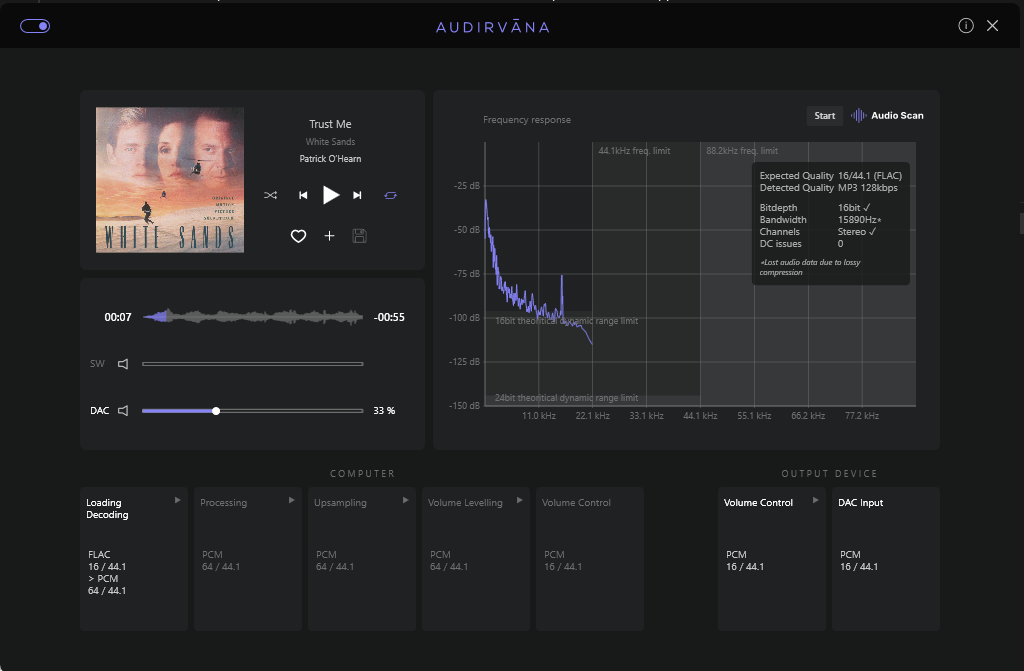
Expected Quality: The quality (resolution and format) featured in the track’s audio file format.

Detected Quality: The analyzed quality depends on the actual bit resolution, frequency resolution, and channel configuration:

It appears in purple with a check sign when the Expected quality and Detected quality actually match. Note that the Audio Scan algorithm is not capable of confirming matching for sampling rates above 192kHz, DSD format, and multichannel tracks, and has only access to the first unfolding of MQA files.

Detected quality can be:
- MP3 when lossy compression is involved with equivalent resolution in kb/s
- Not HD when bit-depth is below 16 bits
- CD quality (Redbook) when matching 16-bit and 44,1 KHz/48kHz, stereo channels
- SemiHiRes meaning the mix contains non-HiRes elements
- HiRes when bit-depth is equal or superior to 24-bit, stereo channel

The information provided to understand why there is or there is not a match is:

Bit depth: Analyses the actual bit resolution of the audio file.

Bandwidth: Returns the actual frequency extension of the track. A note indicates if it has been upsampled.

Channels: Checks the channel content integrity of the audio file. It looks for the following potential issues: - Silence if one channel is silenced - Mono if both channels are the same - Out of phase if the channels are inverted.

DC Issues: This feature detects if there are constant parts in the audio file.


This view is only where you have access to both Audirvāna’s internal software volume settings (SW for software) and that of your audio device if they are enabled of course in the settings.

Audirvāna does indeed have a great internal digital volume control. It is disabled by default, but you can enable it in the audio settings view. This is useful, for example, when the connected device does not allow Audirvāna to control it from the app (grayed volume bar).

You can see in the lower part, the modifications (format, gain, and resolution) of the song at each step of the processing during the playback according to your choices of audio settings.

Thank you for the detailed explanation. Looking at the graphs as you suggest and the relevant atrophy of the signal across the spectrum show some of this. Its the MP3 references I don’t get - is that simply a proxy for where the signal characteristics don’t match up? None of the tracks I mentioned that were analyzed had been anywhere near any form of MP3 encoding or unencoding. These were FLAC tracks converted from WAV files pulled very accurately from CD. And tracks from the same CD show up differently - some shown as CD quality (as expected) and some as low as 128kbs MP3

I’m probably misunderstanding it. Because a Brickwall filter with upsampling does not provide information above 22khz and below -96dB, but there is also a lot of upsampling and with slightly ‘leaky’ to more complete mirrors up to twice the original Nyquist. Here the analysis seems to give quite a false positive HiRes because ‘poor’ upsampling has been applied. The very worst upsampling passes the test with flying colors.

Which tracks and albums give these varying results? There are ‘LoFi’ albums that, even in Flac, do not come close to what is possible with CD quality in terms of signal to noise ratio, dynamic range and frequency spectrum. That’s not necessarily a bad thing, it could be an artistic choice during production. For me, file formats and measurements don’t mean much if you don’t know what the source is. A mega creative album recorded on a multichannel cassette deck may not be suitable for analysis. But still very listenable music.

There is a chance that even well-recorded instruments with a limited tonal range will be marked as MP3. A piano that is only played in low octaves can sound incredibly beautiful, but there is very little ‘energy’ present in the higher frequency spectrum. If the tool does nothing other than measure energy per band/octave, the analysis will often be incorrect in such cases.

Hi Jacob - thanks for your thoughts - this analysis resonates with me as it has been predominantly on Ripped CDs of Film Soundtracks where I have seen it and with ‘gentler’ tracks missing perhaps the energy you speak of. Other tracks ripped in exactly the same way from the same album do not display this behavior when scanned and return CD Quality as expected

I have enclosed 4 Samples from two different soundtrack Albums on CD ripped by EAC in secure Mode - both have one track that is seen as CD-Quality and another that is seen as MP3 by way of examples


If the analyzer only or mainly analyzes the energy across the spectrum and recognizes a file format based on this, then it is an excellent tool to reliably analyze white or pink noise. Audio recordings may have frequency limitations that have nothing to do with the format in which the original file was recorded.

The spike around 15 kHz seems to trigger the tool on a dropoff and thus recognize a frequency limiting MP3.

An NTSC CRT monitor could be present during the recording. This gives a 15.75kHz spike.

Would be interesting. There are many recordings (of orchestras) where CRT monitors are used. Are recordings where there is little energy above 14kHz and a CRT is used indicated as MP3?

bit rate cut-off frequency compression
1411kbps >20kHz 1:1
320kbps 19.5kHz 1:4.4
192kbps 18kHz 1:7.3
160kbps 17kHz 1:8.8
128kbps 16kHz 1:11
96kbps 15kHz 1:14.7
64kbps 11kHz 1:22
32kbps 5kHz 1:44


Probably the green line is what the analysis is looking for. But the CRT monitor near a microphone causes a false analysis on the MP3 128.

@Jacob and what is interesting is that a similar spike is present in both tracks - you have me intrigued I will see if I can find any others and that would then possibly explain the behavior

Sadly as this next set of samples show the explanation is not necessarily from one element. There is a series of samples from a EAC Secure Ripped copy of the Complete Original Motion Picture Score for Avatar and this is all over the place - sample 5 of 5 being the one that was deemed CD Quality - so not sure what this says?


It will be a bit more complex and not always traceable to the same cause, but for me it is difficult to believe that this is a reliable analysis tool.

This topic was automatically closed 90 days after the last reply. New replies are no longer allowed.